Executive Summary
The Capital Asset Pricing Model (CAPM) is a fundamental concept in finance that links risk and expected return. It serves as a tool to determine the expected return on an asset, considering its risk relative to the market. CAPM assumes a linear relationship between the expected return and market risk, encapsulated by the stock’s beta. This model is extensively used for pricing risky securities and calculating cost of equity.

Formula Deep Dive
E(Ri) = Rf + βi * (E(Rm) – Rf)
- Expected Return of an Asset (E(Ri)): represents the anticipated average return an investor seeks from an investment, considering its risk.
- Risk-Free Rate (Rf): is the return of an investment with zero risk, typically represented by government bonds.
- Beta (βi): quantifies the stock’s volatility compared to the overall market. A beta greater than 1 indicates higher volatility than the market, while a beta less than 1 signifies lower volatility.
- Market Return (E(Rm)): represents the average return of the entire market, often estimated by a broad market index like the S&P 500.
The CAPM formula helps in understanding how much return an investor should expect for the risk undertaken. The higher the beta, the greater the return an investor would demand, reflecting the increased risk compared to the market.
Additional Formulas
βi = Cov(Ri,Rm) / Var(Rm)
- Cov(Ri,Rm): is the covariance between the return of the investment (Ri) and the return of the market (Rm).
- Var(Rm): is the variance of the market’s return (Rm).
The beta reflects how much the investment’s return is expected to change in response to changes in the overall market return. A beta greater than 1 indicates that the investment is more volatile than the market, while a beta less than 1 indicates it is less volatile. Calculating beta is essential in financial analysis for assessing risk and is a key component in the CAPM.
Application in Excel
To calculate the expected return of an asset in Excel, the beta should be calculated first. The example below shows the covariance between the asset return and the market return of 0.06 (cell B1) and the variance of the market return of 0.04 (cell B2). The beta can then be calculated as follows:
=B1/B2
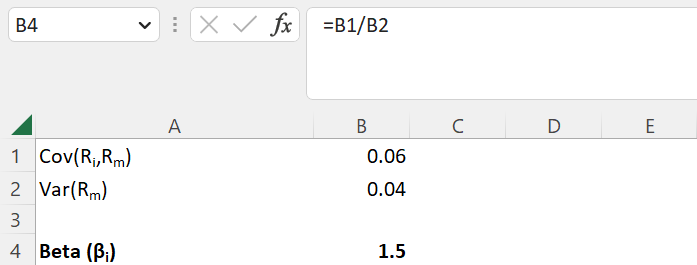
By using the calculated beta of 1.5 (cell B4) in combination with a risk-free rate of 1% (cell B6) and an expected market return of 5% (cell B7), the expected return of an asset can be determined with the following formula:
=B6+B4*(B7-B6)

In Excel, this formula calculates the expected return by adding the risk-free rate to the product of the stock’s beta and the market risk premium (market return minus the risk-free rate). The CAPM is particularly useful in practice as it provides an expected asset return that can serve as discount rate for other models such as the Dividend Discount Model (DDM). Hence, the CAPM is a valuable model for portfolio managers and individual investors in making informed decisions about their investments based on expected returns and market risk.
See also:
Disclaimer: The information provided on this website is for educational purposes only and is not intended for use as legal, financial, or tax advice. While every effort is made to ensure the accuracy and reliability of the content, Maths for Finance makes no representations or warranties of any kind, express or implied, about the completeness, accuracy, reliability, suitability, or availability with respect to the website or the information, products, services, or related graphics contained on the website for any purpose. Any reliance you place on such information is therefore strictly at your own risk. In no event will Maths for Finance be liable for any loss or damage including without limitation, indirect or consequential loss or damage, or any loss or damage whatsoever arising from loss of data or profits arising out of, or in connection with, the use of this website. Please further review our Terms of Service.
