Executive Summary
Continuously compounded returns represent the logarithmic return of an investment, assuming that the return is constantly being reinvested at the same rate. This concept is crucial in financial modeling and analysis because it provides a more accurate reflection of investment performance over time, especially when comparing investments with different compounding frequencies. The key advantage of using continuously compounded returns is its simplicity in mathematical operations, particularly when aggregating returns over time or across different assets.

Formula Deep Dive
r = ln((PT + D) / P1)
- Continuously compounded return (r): is a measure used in finance to calculate the return on an investment assuming the interest is compounded continuously, rather than at discrete intervals.
- Beginning Price (P1): is the initial value of the investment at the start of the period.
- Ending Price (PT): is the value of the investment at the end of the period T.
- Dividend (D): is a payment made by a corporation to its shareholders, usually as a distribution of profits.
Continuous compounding often returns slightly less than Simple Returns because it applies interest on a constantly changing principal amount, while simple interest applies interest on the original principal only, once per period. As a result, the growth in continuous compounding is gradual and accumulates over many small intervals, whereas simple interest grows in larger, fixed increments.
In practical usage, continuously compounded returns are especially useful in theoretical finance models, such as the Black-Scholes model for option pricing, where continuous compounding aligns with the assumptions of continuous trading.
Additional Formulas
Average Return (Time Series)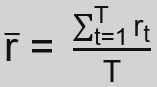
Average Return (Cross Sectional)
Annualization
rA = r × n
Ending Value
PT = P1 × e(T × r)
Derivation from Simple Returns
r = ln(1 + R)
- Continuously compounded return (r): is a measure used in finance to calculate the return on an investment assuming the interest is compounded continuously, rather than at discrete intervals
- Total number of time intervals (T): describes the total number of time intervals over the corresponding time period. Each interval is denoted as t.
- Weights (wi): describes the value proportion of an asset with index i in relation to the value of the portfolio.
- Annualized Return (rA): refers to the return of a time horizon of one year.
- Time Intervals per Year (n): refers to the periods into which a year is divided to calculate returns. A return can for example be a monthly (12 intervals per year) or quarterly (4 intervals per year) return.
- Beginning Price (P1): is the initial value of the investment at the start of the period.
- Ending Price (PT): is the value of the investment at the end of the period T.
- Simple Return (R): is the percentage change in the value of an investment over a specified period, reflecting its profit or loss.
Application in Excel
To calculate continuously compounded returns in Excel, you use the natural logarithm function, LN(). In the example below, we buy one Apple stock on 17/01/23 at a price of 135.94 (cell E2) and sell it on 17/02/23 at 152.55 (cell E3). Assuming that no dividend was paid, we get a continuously compounded return of 11.53% for a time horizon of one month by applying the following formula:
=LN(E3/E2)

In this example, it can make sense to annualize the calculated returns to allow comparisons with other investments. Since the returns in our example represent one month, we can annualize continuously compounded returns in our example annualized as follows:
=E4 * 12

Continuously compounded returns are particularly relevant for financial analysts and investors who are comparing the performance of different investments over varying time horizons.
See also:
Disclaimer: The information provided on this website is for educational purposes only and is not intended for use as legal, financial, or tax advice. While every effort is made to ensure the accuracy and reliability of the content, Maths for Finance makes no representations or warranties of any kind, express or implied, about the completeness, accuracy, reliability, suitability, or availability with respect to the website or the information, products, services, or related graphics contained on the website for any purpose. Any reliance you place on such information is therefore strictly at your own risk. In no event will Maths for Finance be liable for any loss or damage including without limitation, indirect or consequential loss or damage, or any loss or damage whatsoever arising from loss of data or profits arising out of, or in connection with, the use of this website. Please further review our Terms of Service.
