Executive Summary
The P/E ratio measures a company’s current share price relative to its per-share earnings. It’s a key indicator used by investors to evaluate the relative value of a company’s shares. A higher P/E ratio might suggest that investors are expecting higher earnings growth in the future compared to companies with a lower P/E ratio. However, this ratio must be interpreted within the context of the industry sector, as different sectors have different average P/E ratios.

Formula Deep Dive
P/E Ratio = Share Price / EPS
- Share Price: is the current trading price of the company’s stock.
- Earning per Share (EPS): represents the company’s net income divided by the number of outstanding shares.
The practical usage of the P/E ratio lies in its ability to provide a quick snapshot of market expectations about a company’s future earnings growth. It’s a fundamental analysis tool often used by investors to determine if a stock is overvalued or undervalued. For instance, a high P/E ratio could mean that a company’s stock price is high compared to earnings and possibly overvalued, or it could indicate that investors are expecting high growth rates in the future.
Application in Excel
To calculate the P/E ratio in Excel, you typically gather the required data (market value per share and EPS) either from financial statements or financial websites. In the example below, it is given a net income of 26 (cell B12), a share price of 15.60 (cell E7) and 10 shares outstanding (cell E8). The earnings per share can be derived by dividing the net income by the numbers of shares outstanding:
=B12/E8
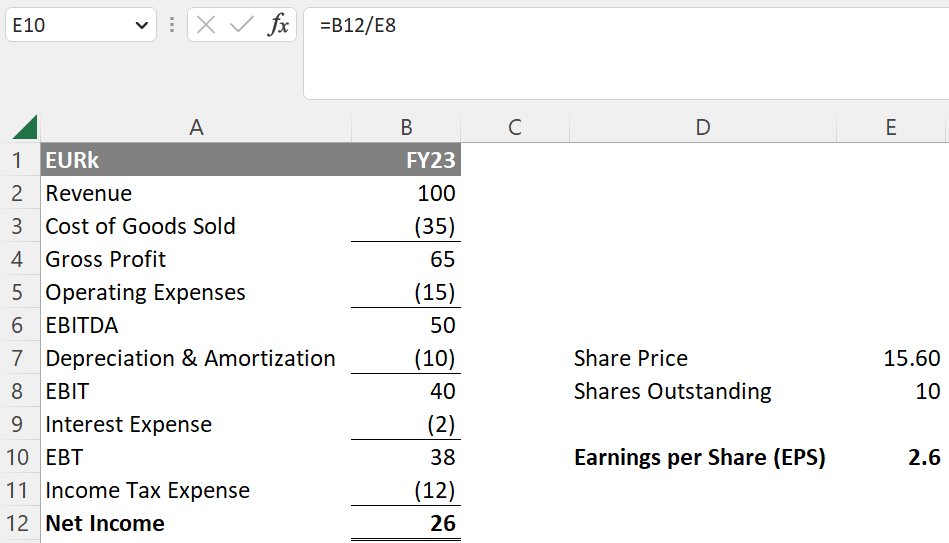
This formula results in earnings per share of 2.6. The P/E ratio can then be obtained by diving the share price (cell E7) by the earnings per share (cell E10):
=E7/E10
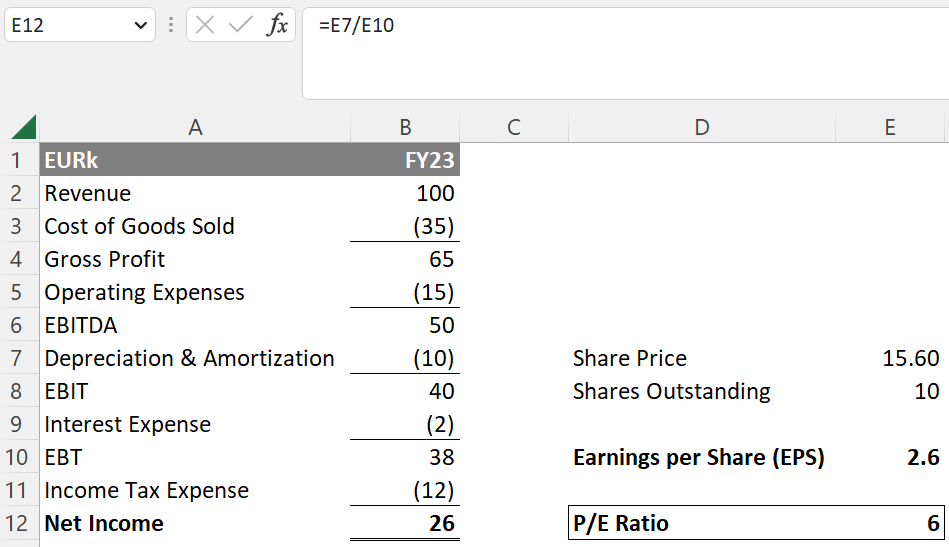
This results in a P/E ratio of 6. When interpreting this result, it’s important to compare this ratio to industry-specific averages, as typical P/E ratios vary between sectors. Therefore, it should be analyzed alongside other financial metrics and market trends for a comprehensive assessment. In practice, financial analysts and investors use this formula for comparing companies within the same industry, assessing stock market trends, or making investment decisions.
See also:
Disclaimer: The information provided on this website is for educational purposes only and is not intended for use as legal, financial, or tax advice. While every effort is made to ensure the accuracy and reliability of the content, Maths for Finance makes no representations or warranties of any kind, express or implied, about the completeness, accuracy, reliability, suitability, or availability with respect to the website or the information, products, services, or related graphics contained on the website for any purpose. Any reliance you place on such information is therefore strictly at your own risk. In no event will Maths for Finance be liable for any loss or damage including without limitation, indirect or consequential loss or damage, or any loss or damage whatsoever arising from loss of data or profits arising out of, or in connection with, the use of this website. Please further review our Terms of Service.
