Executive Summary
Simple return is a fundamental concept in finance, used to measure the return on an investment over a specific period (usually one year). It reflects the percentage increase or decrease in the value of an investment over that period. This return calculation is straightforward and widely used due to its simplicity. It is particularly useful for comparing returns of different investments over the same time period.

Formula Deep Dive
R = (PT – P1 + D) / P1
- Simple Return (R): is the percentage change in the value of an investment over a specified period, reflecting its profit or loss.
- Ending Price (PT): is the value of the investment at the end of the period T.
- Beginning Price (P1): is the initial value of the investment at period 1.
- Dividend (D): is a payment made by a corporation to its shareholders, usually as a distribution of profits.
The simple return formula calculates the gain or loss made on an investment relative to its initial cost. It is expressed as a percentage, making it easier to understand and compare the performance of different investments. Simple returns are most appropriate for short-term investments and for cases where the investment does not generate returns at multiple intervals within the period.
Additional Formulas
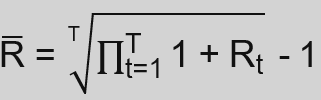
Average Return (Cross Sectional)

Annualization
RA = R × n
RAe = (1 + R)n – 1
Ending Value
PT = P1 × (1 + R)T
Derivation from Continuously Compounded Returns (r)
R = er – 1
- Simple Return (R): is the percentage change in the value of an investment over a specified period, reflecting its profit or loss.
- Total number of time intervals (T): describes the total number of time intervals over the corresponding time period. Each interval is denoted as t.
- Weight (wi): describes the value proportion of an asset with index i in relation to the value of the total number of assets (N) of the portfolio.
- Simple annualized Return (RA): refers to the return of a time horizon of one year without taking compounding effects into account.
- Effective annualized Return (RAe): refers to the return of a time horizon of one year that takes compounding effects into account.
- Time Intervals per Year (n): refers to the periods into which a year is divided to calculate returns. A return can for example be a monthly (12 intervals per year) or quarterly (4 intervals per year) return.
- Ending Price (PT): is the value of the investment at the end of the period T.
- Beginning Price (P1): is the initial value of the investment at period 1.
- Continuously compounded return (r): is a measure used in finance to calculate the return on an investment assuming the interest is compounded continuously, rather than at discrete intervals.
Application in Excel
To calculate simple returns in Excel, you need two pieces of data: the beginning and ending values of your investment. Let’s, for example, look at the daily closing prices of Apple stock. In the example below, we buy one Apple stock on 17/01/23 at a price of 135.94 (cell E2) and sell it on 17/02/23 at 152.55 (cell E3). Assuming that no dividend was paid, we get a simple return of 12.2% for a time horizon of one month by applying the following formula:
=(E3 – E2) / E2

This formula will give you the simple return as a decimal. To convert it to a percentage as shown in the example above, you can format the cell containing the formula to show percentages.
Since simple returns are usually represented as yearly return, the 12.2% for a time horizon of one month may not be very intuitive. We can calculate an annualized return without compounding (simple annualized return):
=E4 * 12
As an alternative we can also calculate an annualized return with compounding (effective annualized return):
=(1 + E4)12 – 1

Whilst annualized returns allow comparisons with other annual returns, in this case the annual returns may not be very realistic due to the volatile nature of stocks as an asset class. In practical terms, the shown calculation are useful for individual investors, financial analysts, and portfolio managers who need to assess the performance of investments over a specific timeframe.
See also:
Disclaimer: The information provided on this website is for educational purposes only and is not intended for use as legal, financial, or tax advice. While every effort is made to ensure the accuracy and reliability of the content, Maths for Finance makes no representations or warranties of any kind, express or implied, about the completeness, accuracy, reliability, suitability, or availability with respect to the website or the information, products, services, or related graphics contained on the website for any purpose. Any reliance you place on such information is therefore strictly at your own risk. In no event will Maths for Finance be liable for any loss or damage including without limitation, indirect or consequential loss or damage, or any loss or damage whatsoever arising from loss of data or profits arising out of, or in connection with, the use of this website. Please further review our Terms of Service.
